[Notes & HW Answers] 5.1 How Do We Measure Distance Traveled?
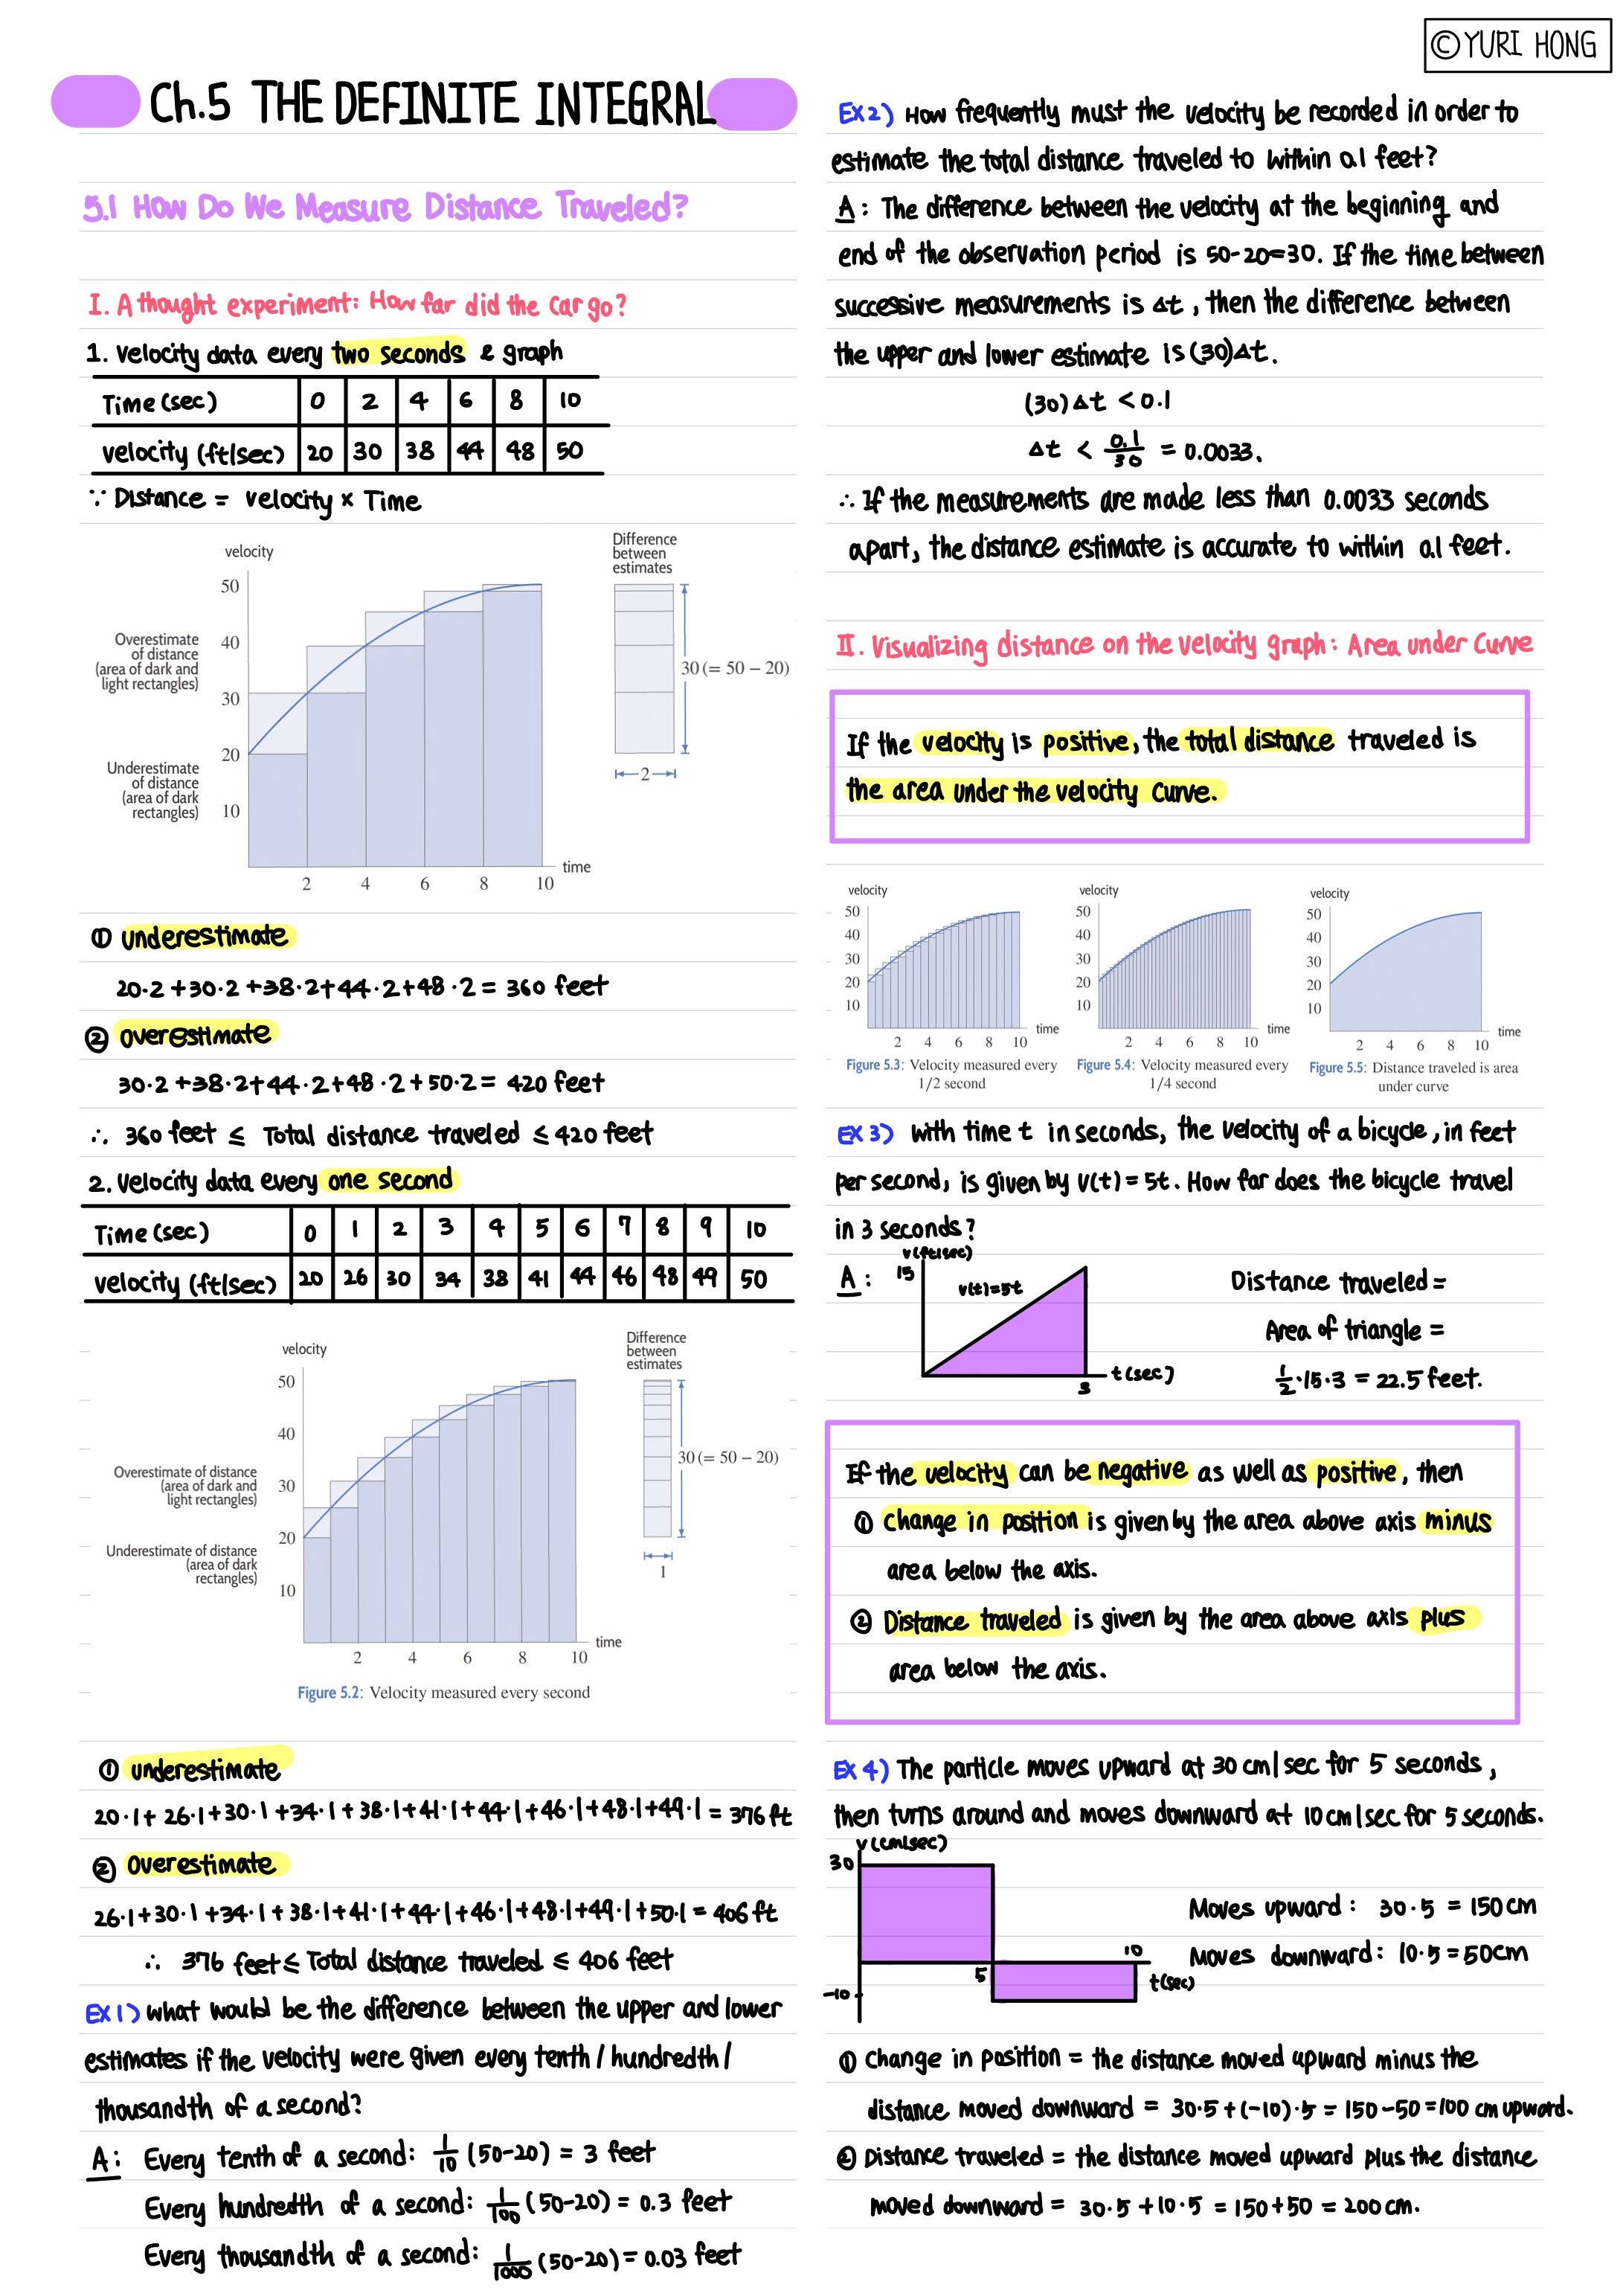

[Prepwork 5.1]
Q1. Consider the velocity data for the car shown in table 5.1. Find lower and upper estimates for the distance it travels between 𝑡=4 and 𝑡=8.
A:
lower = 164
upper = 184
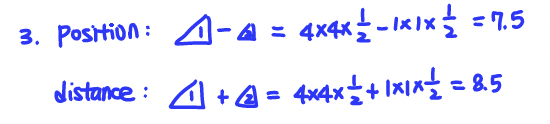
Write the difference between these as the following product:

What is the total distance that the ball traveled? 8.5 m
[HW 5.1]
Q1. The velocity 𝑣(𝑡) in the table below is increasing for 0≤𝑡≤12.
| 𝑡 | 0 | 3 | 6 | 9 | 12 |
| 𝑣(𝑡) | 31 | 36 | 37 | 38 | 40 |
A. Find an upper estimate for the total distance traveled using
𝑛=4 subdivisions: distance traveled = 453
𝑛=2 subdivisions: distance traveled = 462
B. Which of the two answers in part (A) is more accurate?
𝑛= 4 is more accurate
C. Find a lower estimate for the total distance traveled using 𝑛=4.
distance traveled = 426

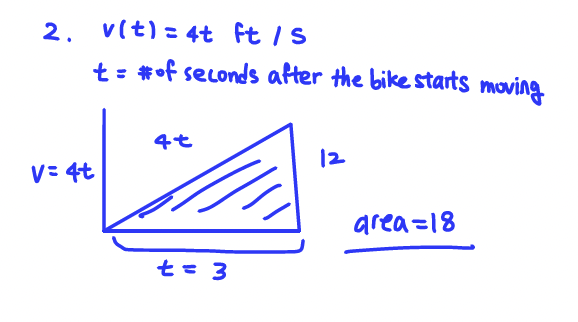
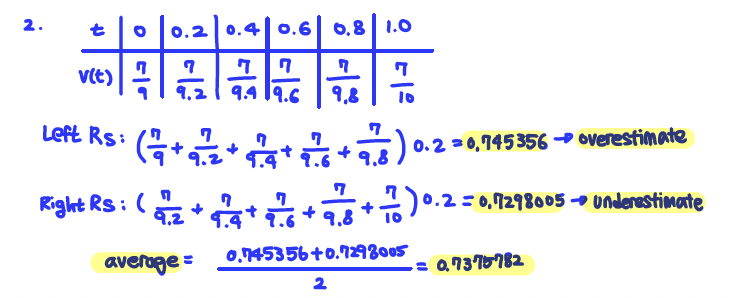
Q2. For time, 𝑡, in hours, 0≤𝑡≤1, a bug is crawling at a velocity, 𝑣, in meters/hour given by
Use Δ𝑡=0.2 to estimate the distance that the bug crawls during this hour. Use left- and right-hand Riemann sums to find an overestimate and an underestimate. Then average the two to get a new estimate.
underestimate = 0.7298005 m
overestimate = 0.745356 m
average = 0.7375782 m
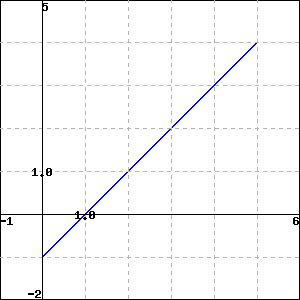
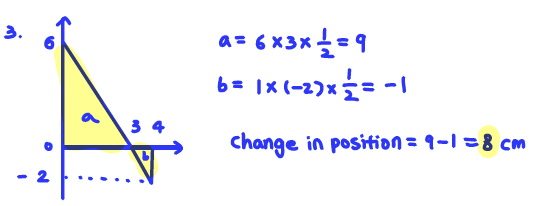
Q3. The velocity of a particle moving along the 𝑥-axis is given by 𝑓(𝑡)=6−2𝑡 cm/sec. Use a graph of 𝑓(𝑡) to find the exact change in position of the particle from time 𝑡=0 to 𝑡=4 seconds.
A: change in position = 8 cm
Q4. Two cars start at the same time and travel in the same direction along a straight road. The figure below gives the velocity, 𝑣 (in km/hr), of each car as a function of time (in hr).
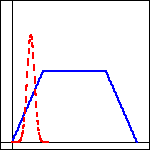
The velocity of car A is given by the solid, blue curve, and the velocity of car B by dashed, red curve.
(a) Which car attains the larger maximum velocity?
A. A
B. B
(b) Which stops first?
A. A
B. B
(c) Which travels farther?
A. A
B. B
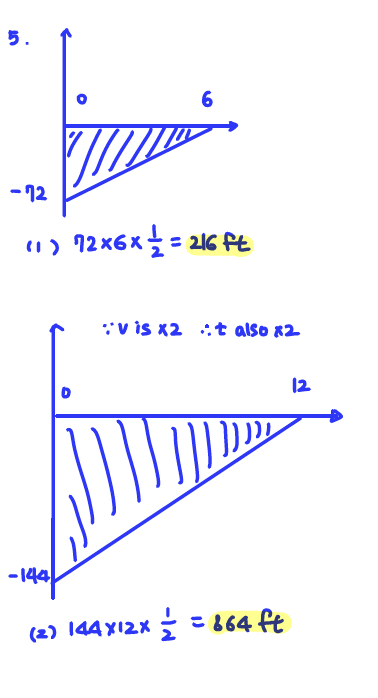
Q5. A car initially going 72 ft/sec brakes at a constant rate (constant negative acceleration), coming to a stop in 6 seconds.
Graph the velocity for 𝑡=0 to 𝑡=6. How far does the car travel before stopping?
A:
distance = 216 ft
How far does the car travel before stopping if its initial velocity is doubled, but it brakes at the same constant rate?
distance = 864 ft